Key tools/skills:
- Brazilian E-Commerce Public Dataset by Olist as a data source
- Jupyter Notebook and Python as a data analysis tool
- Streamlit as a data visualization tool
- Data Analysis
- Data Visualization
Project : https://github.com/nairkivm/e-commerce-public-data-project
Introduction
As part of my final data project in the data science course from Dicoding, I conducted an end-to-end data analysis for an e-commerce platform and created a comprehensive dashboard. Here’s a step-by-step explanation of how I approached the analysis.
First: Define the Business Questions
Effective business questions are crucial for achieving business objectives and solving problems. To formulate effective business questions, we can use the SMART criteria: questions should be Specific, Measurable, Action-oriented, Relevant, and Time-bound. For this e-commerce dataset, the business questions are:
- What is the relationship between product review scores and sales?
- Which locations have the highest product usage?
- How has the company’s sales performance been over the last three months?
- Which products have the highest and lowest sales?
- When were the last transactions made by consumers?
- How frequently do customers make transactions?
- How much money do consumers spend?
Second: Data Wrangling
In this stage, data is collected to answer the analytical questions formulated earlier. The quality and structure of the data are then assessed to identify any issues and develop an appropriate data cleansing strategy. For this project, I created a function to automatically generate data assessments after each process.
This is the example of the assessment report.
Data Assessment for 'order_reviews':
 > Data shape:  (99224, 7)
 > No column should be dropped v
 > All requirements columns are exists v
 > Mismatch type columns:
      01. 'review_score' column should be in 'float64' (original: int64)!
      02. 'review_creation_date' column should be in 'datetime64[ns]' (original: object)!
      03. 'review_answer_timestamp' column should be in 'datetime64[ns]' (original: object)!
 > Missing value columns:
      - review_comment_title column : 88.34% (87656)
      - review_comment_message column : 58.70% (58247)
 > There is no duplicated data v
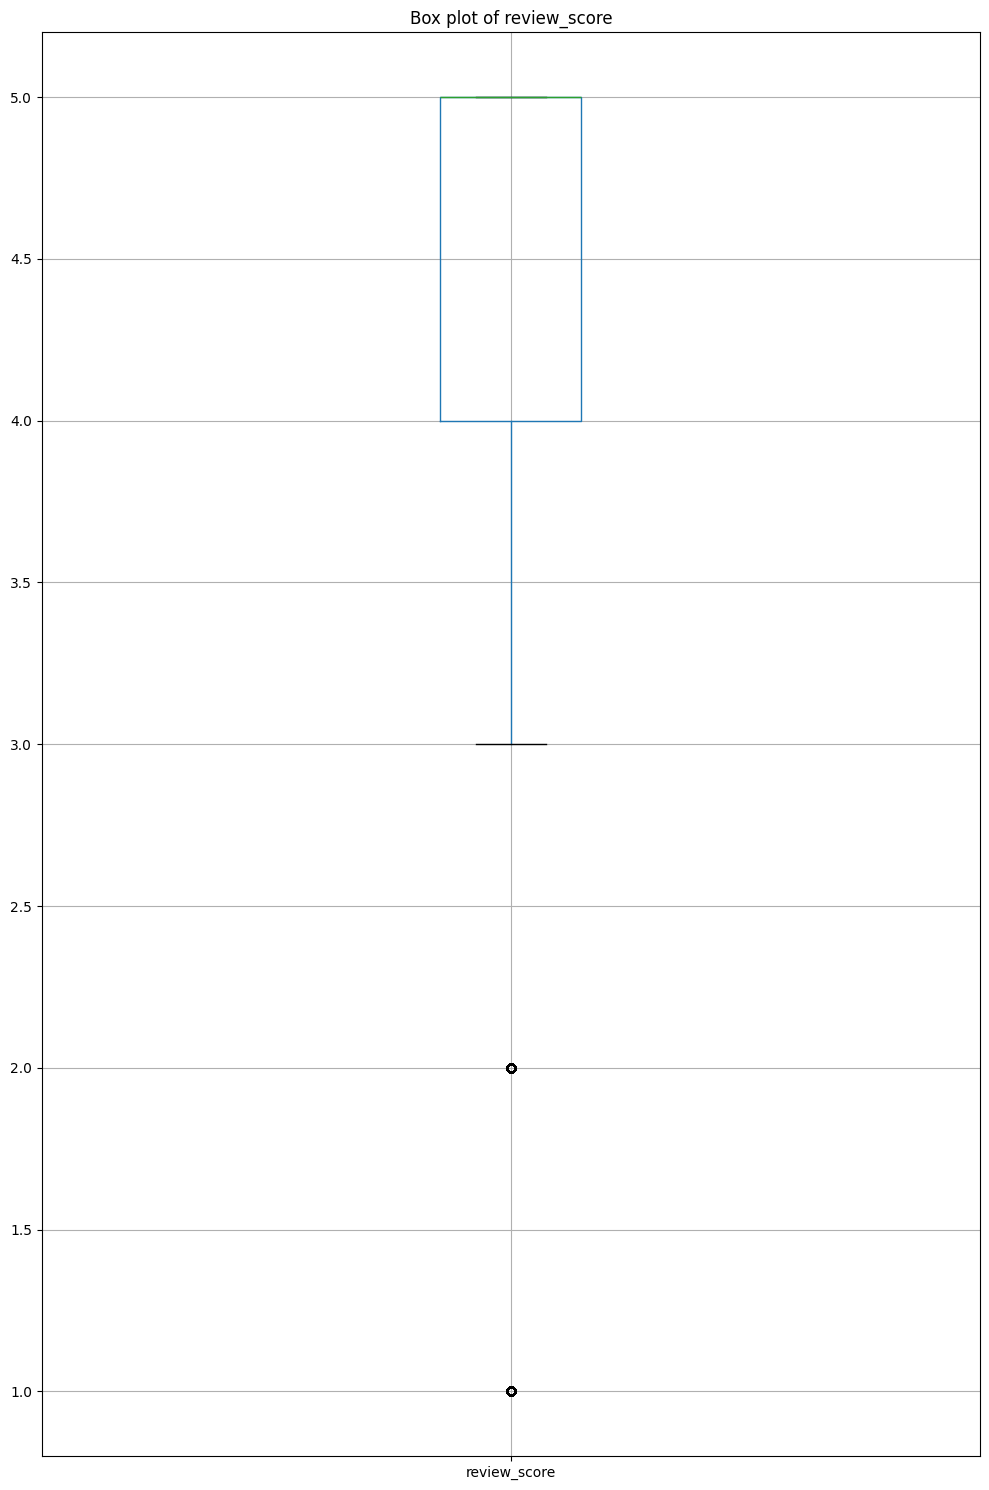
 > The outliers (review_score):

Third: Exploratory Data Analysis
At this stage, the cleaned data is explored to gain insights and answer the analysis questions. The exploration process typically involves using various descriptive statistics techniques to identify patterns, relationships, and build intuition about the data. By utilizing the describe method from the pandas DataFrame, we can effortlessly obtain descriptive statistics.
----------------------------------------------------------------------
Table: customers
----------------------------------------------------------------------
                             customer_id                customer_unique_id  \
count                              99441                             99441
unique                             99441                             96096
top     274fa6071e5e17fe303b9748641082c8  8d50f5eadf50201ccdcedfb9e2ac8455
freq                                   1                                17

        customer_zip_code_prefix customer_city customer_state
count                      99441         99441          99441
unique                     14994          4119             27
top                        22790     sao paulo             SP
freq                         142         15540          41746
From this example of the EDA result of customer table, I gained some insights, like the most customer comes from Sao Paulo city (15,540 people) and SP state (41,746 people). These insights must be collected in order to help answering the business problems.
Fourth: Visualization & Explanatory Analysis
In this stage, a thorough analysis is conducted to address the business problems, and the findings are communicated using clear and precise visualizations. I extensively used join and aggregate data manipulation techniques to derive solutions and employed graphing tools like Matplotlib, Plotly, and Seaborn to visualize the results. Additionally, I created a dashboard using Streamlit to compile and present the results and visualizations.
Last: Drawing Conclusion and Publishing the Result
The conclusions must address all the questions and objectives defined earlier. Furthermore, the findings or insights from the analysis need to be shared through various means, such as reports, slide decks, and presentations.
The conclusion of the data analysis conducted in this project are:
- The correlation between average review ratings and total sales is very weak, indicating no significant relationship.
- By state, the highest product usage is in SP, while by city, the highest product usage is in São Paulo, SP.
- Sales performance over the last three months has shown a slight increase in revenue, while the number of orders has slightly decreased.
- In terms of units sold, the most sold products are in the categories of bed bath table, health beauty, sports leisure, furniture decor, and computers accessories. The least sold products are in the categories of security and services, fashion children clothes, CDs DVDs musicals, la cuisine, and arts and craftsmanship. However, this differs slightly when viewed from the revenue performance perspective.
- From the initial RFM analysis, the recency of the five customers with the most recent transactions is on average one day, the frequency of the five customers with the highest frequency is on average about nine orders, and the monetary value of the five customers with the highest spending is on average about 8,000 currency units.
Posted on 2024-10-13