The platform/tools used:
- Data cleaning & manipulation : Pandas
- Database System : SQLite
- Container : Docker
- App Deployment & Dashboard : Streamlit
Introduction
A few months ago, my “Data Student” community posted a flash challenge to analyze a product data, scraped from well-known Indonesian minimarkets: Indomaret and Alfamart. It contains information about the list of products, along with the price and the discount history. The data is updated daily and stored in an SQLite database. Details of the data access and the author is in this project repository.
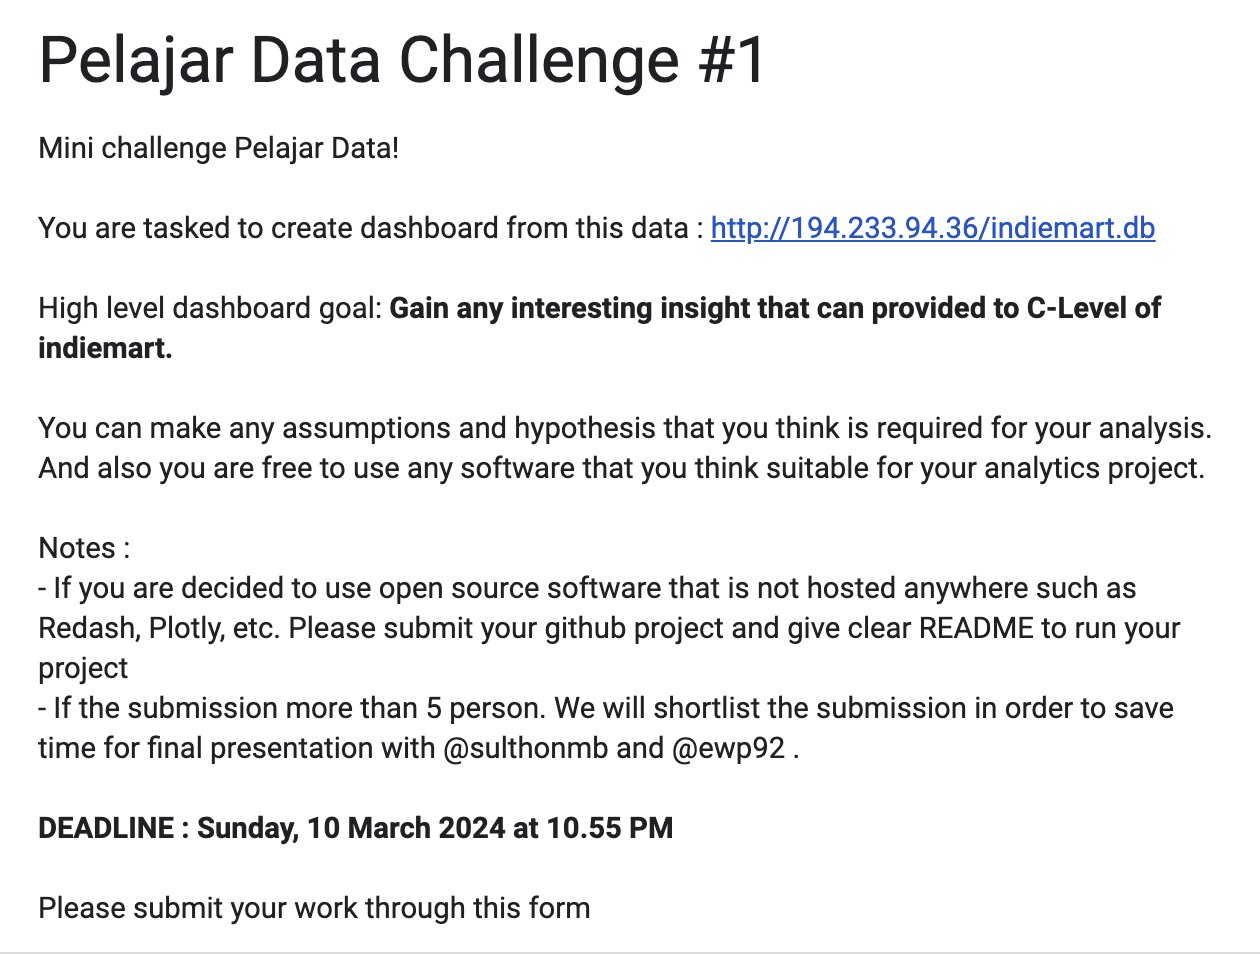
The goal of this challenge is to gain any interesting insights that can be provided to a C-Level of Indiemart (an imaginary company that sells these products). The requirements is shown in the figure below.
After thorough examinations, I decided to make a script to capture the data and show it in a dashboard via Streamlit. For the business questions, I wanted to present a summary of the overall product’s description and compare the affordability of the products between rivaling minimarket.
The data size is about 2 GB when I was starting this project, a relatively big dataset. I also found out that the data was still need a little cleaning. A product from different sources may have different names. Some products that should have been in the same category fall in various groups. I did manual grouping, reinforced by Microsoft Copilot AI skill.
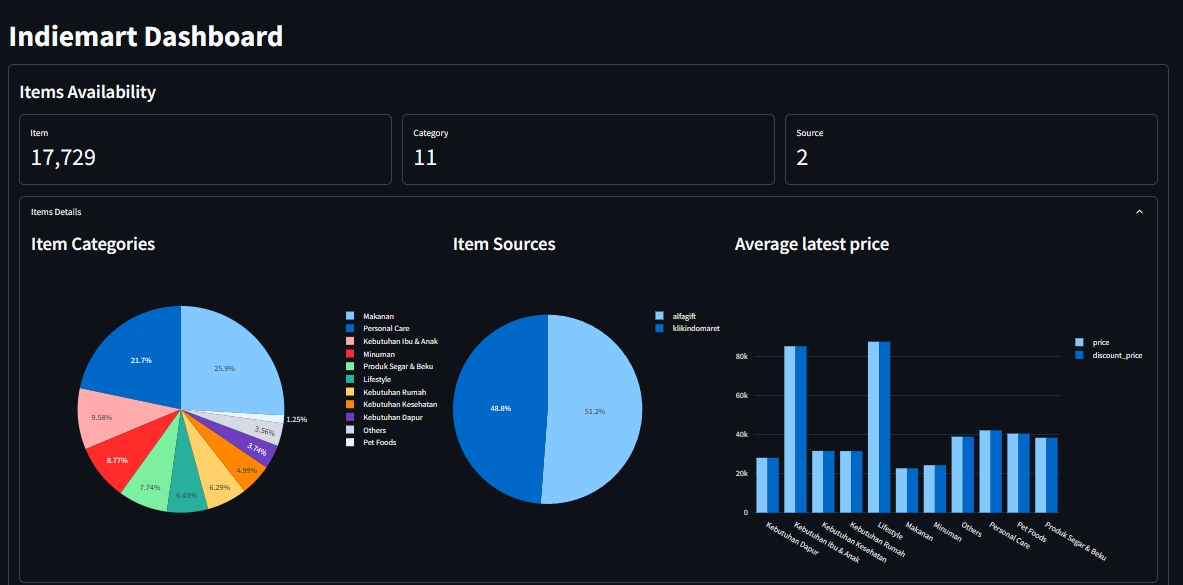
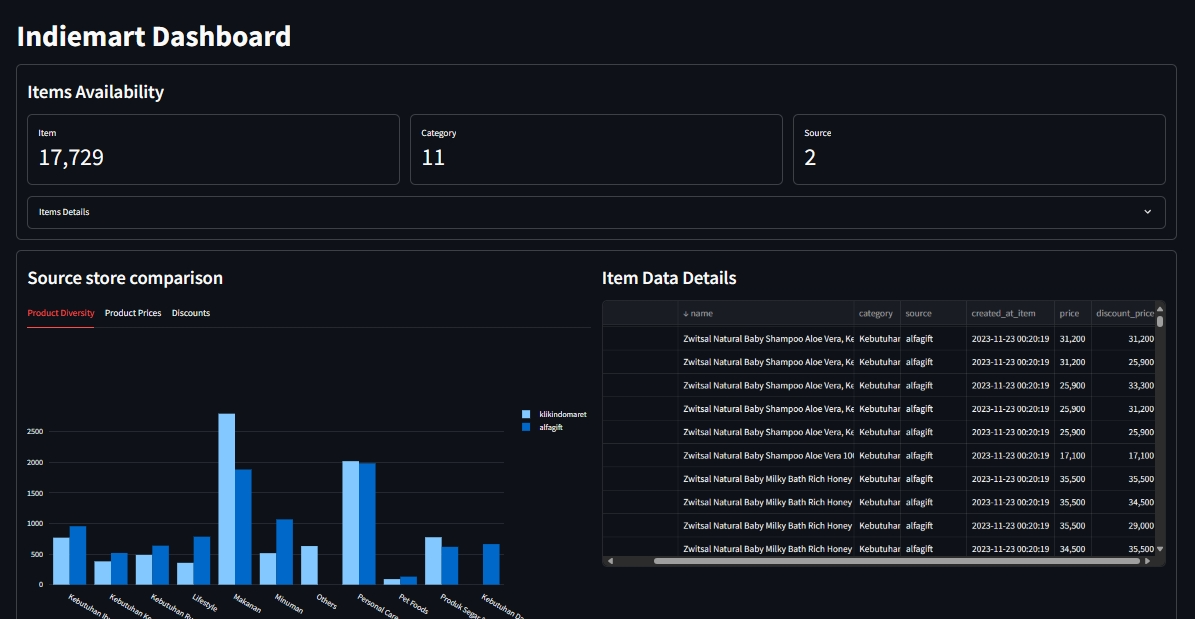
Finally, I used Streamlit to display the dashboard, showing general descriptions of the products (item, category, and source counts) and some statistics on the top. On the bottom part, there are some details about comparison between the two souces and display of the product details.