The tools that I used:
- Extract data : Google Sheets
- Workflow Management : Apache Airflow
- Data cleaning & manipulation : Pandas
- Database Connection : Psycopg2
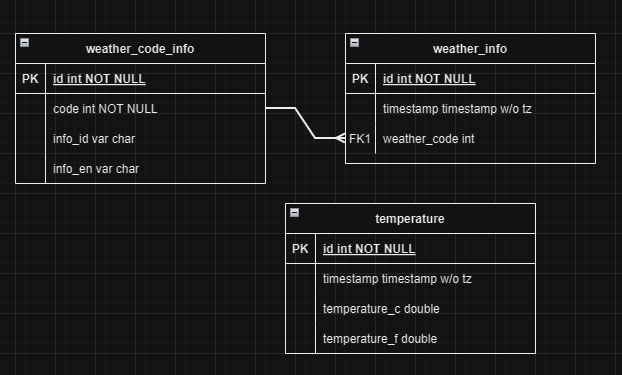
- Database System : PostgreSQL
- Container : Docker
- App Deployment & Dashboard : Streamlit
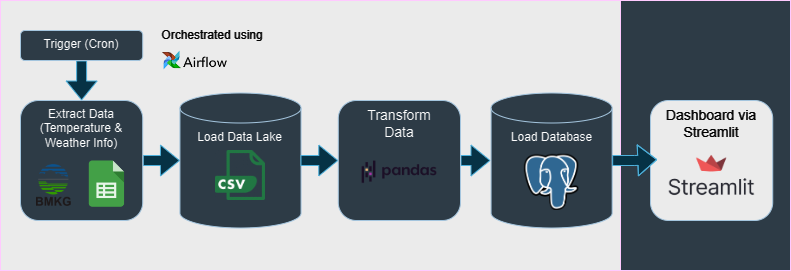
This is an end-to-end data engineering project that extracts weather forecast data from BMKG (Indonesian agency for meteorology, climatology, and geophysics), stores it in a local database, and feeds the data into a dashboard. I built this entirely in Python.
To extract the data, I wanted to use BMKG’s API, but it was blocked and their website prevented scraping. So, I found a workaround using “IMPORTHTML” and “IMPORTXML” formulas from Google Sheets (I don’t know why web scraping doesn’t work, but this Google Sheets formula trick does). Here’s the link to copy the Google Sheets file.
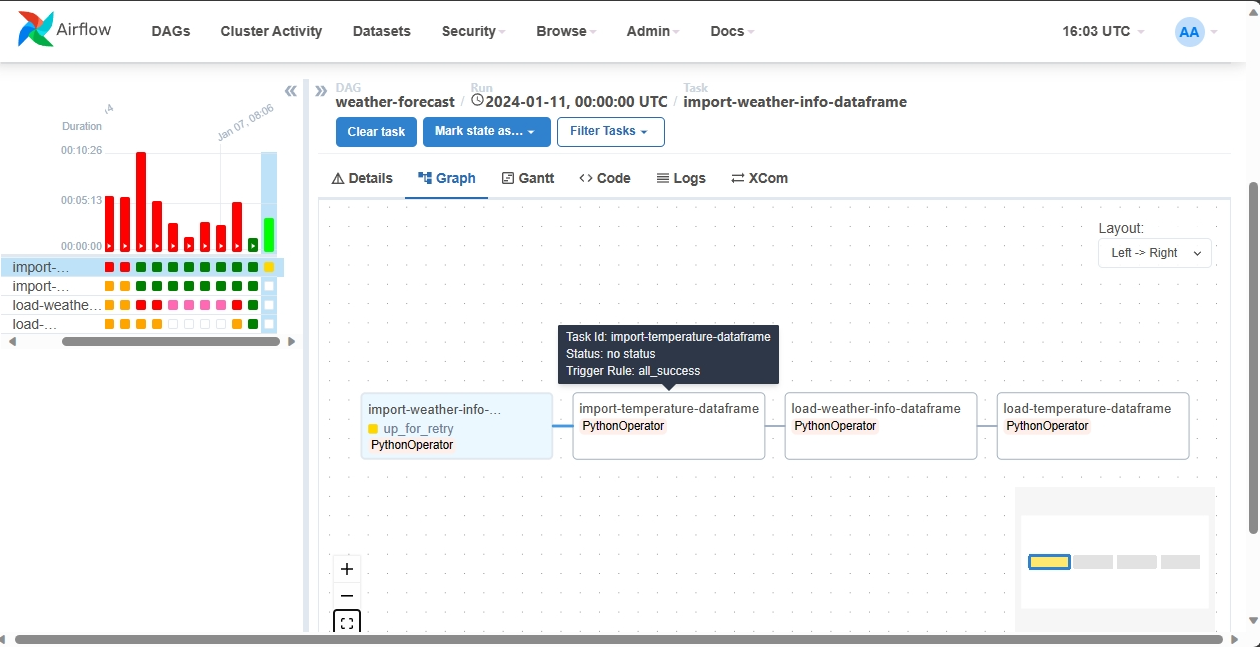
After I extracted the data, I stored the raw data into a data warehouse. I was afraid to use S3 storage (because they can charge me if I’m careless), so I just stored the data locally. And then, I processed the raw data into clean data, heavily utilizing the pandas module, and stored it in a database (that also ran on my local PostgreSQL server). I used the psycopg2 module to connect PostgreSQL and Python. I created a scheduled workflow of extract-load-transform data daily using Apache Airflow, run inside a Docker container.
After that, I used Streamlit, an app framework in Python, to display a dashboard showing the weather forecast and the temperature of Kab. Kupang, NTT. Initially, I wanted to connect the app with the database, but I ran my database locally, so it was unsafe and unreliable. For displaying purposes, the data source came from this project directory.
Trivia:
- This was just a sample project, so the dataset was small. I deliberately chose a location and omitted other metrics, like humidity, wind direction, etc.
- I chose Kab. Kupang, NTT because that is a city where the Indonesian National Observatory (at Mount Timau) takes place, so this dashboard could be used to track the weather for astronomy observation purpose.