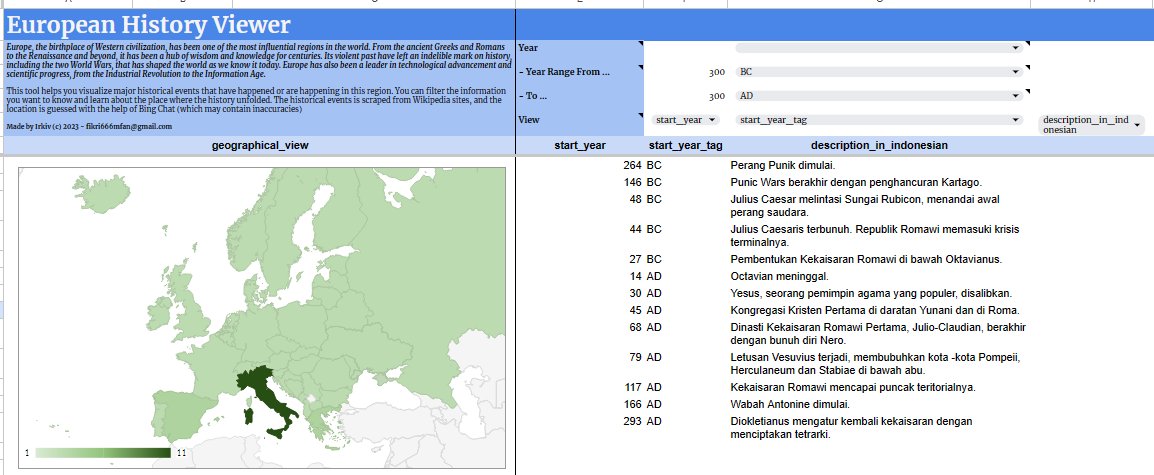
I’ve been playing a lot of Rise of Nations lately, and it’s gotten me interested in world history, particularly the European. I also wanted to show off my data skills, so I made a cool thing called the European History Viewer. It’s a dashboard that shows you what happened in Europe over time and where the event(s) took place, and I got all the data from Wikipedia. Pretty neat, huh? 😎
This might be very simple and unimpressive. I just used Google Sheets, the data is not complex, the dashboard is very simple, and the display is not attractive. Can this be called a data project??
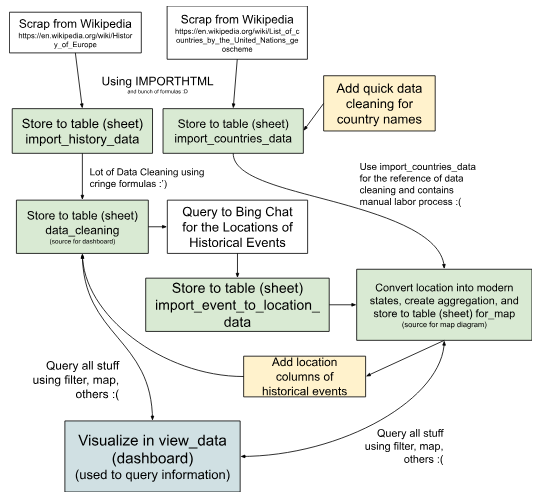
Anyway, this is the framework of this project.
- I extracted the data from a table in History of Europe page and list of countries in the world page into a spreadsheet file using a Google Sheets formula,
IMPORTHTML - I put the data into its respective tables (sheets) inside a “data warehouse” (because Spreadsheet is not really a database system!)
- Using various formulas, I cleaned the data into more organized and comprehensible form.
- Because the list of history from the Wikipedia page has no information about the country(-es) where the historical event took place, I asked Bing AI to query that lost information. I store and cleaned the data into another table (sheet).
- I “joined” the list of history table and list of all countries using various formulas, especially
FILTER,MAP, andARRAYFORMULA. - Finally, I made a “dashboard” that contains a customizable table that can display any field of information with certain filters. I also added a map where the event took place.
That’s all. If you are interested in this projects, you can copy it yourself from this link!